
Reading marketplace price trends means analyzing completed sale prices to determine what buyers actually pay, not what sellers hope to receive. On Facebook Marketplace, this distinction separates profitable resellers from those who overpay or underprice. Knowing how to read marketplace price trends requires pulling sold transaction data, adjusting for platform fees, and interpreting price signals with discipline. Tools like FlowLister, eBay sold comps, and Dealflip make this process faster and more accurate. Get this right, and you stop guessing. You start buying and selling with confidence.
How to read marketplace price trends using sold transaction data
Sold transaction data is the foundation of accurate price trend analysis. Active listing prices reflect seller optimism, not buyer willingness to pay. Only completed sales tell you what the market actually cleared at. This is the single most important principle for any reseller working Facebook Marketplace.
The standard method for analyzing price trends involves these steps:
- Search for recently sold items in the same category and condition. Focus on the last 90 days. Sales older than that may reflect a market that no longer exists.
- Pull 5 to 10 sold comparables (comps) at the same condition grade and similar trim or configuration. A PlayStation 5 Disc Edition and a Digital Edition are not the same comp.
- Weight recent sales more heavily. A sale from last week matters more than one from 60 days ago. If prices are falling, older comps will mislead you upward.
- Map your comps across three percentile ranges. The 25th percentile shows the floor (quick-sale price), the 50th percentile shows fair market value, and the 75th percentile shows the ceiling for patient sellers.
- Ignore active listings entirely when building your trend picture. Asking prices overstate actual sale prices by 30 to 80%. That spread is not a negotiating buffer. It is noise.
Once you have your comp set mapped, you can see whether prices are rising, falling, or holding steady. A comp set where recent sales cluster near the 75th percentile signals strong demand. A comp set where recent sales keep dropping toward the 25th percentile signals a softening market. That directional read is your trend.
Pro Tip: On eBay, filter by "Sold Items" to build your comp set fast. On Facebook Marketplace, screenshot sold listings before they disappear. Dealflip's Facebook Marketplace Value Estimator automates this process by pulling real transaction data so you skip the manual search.

Why fees change how you interpret price data
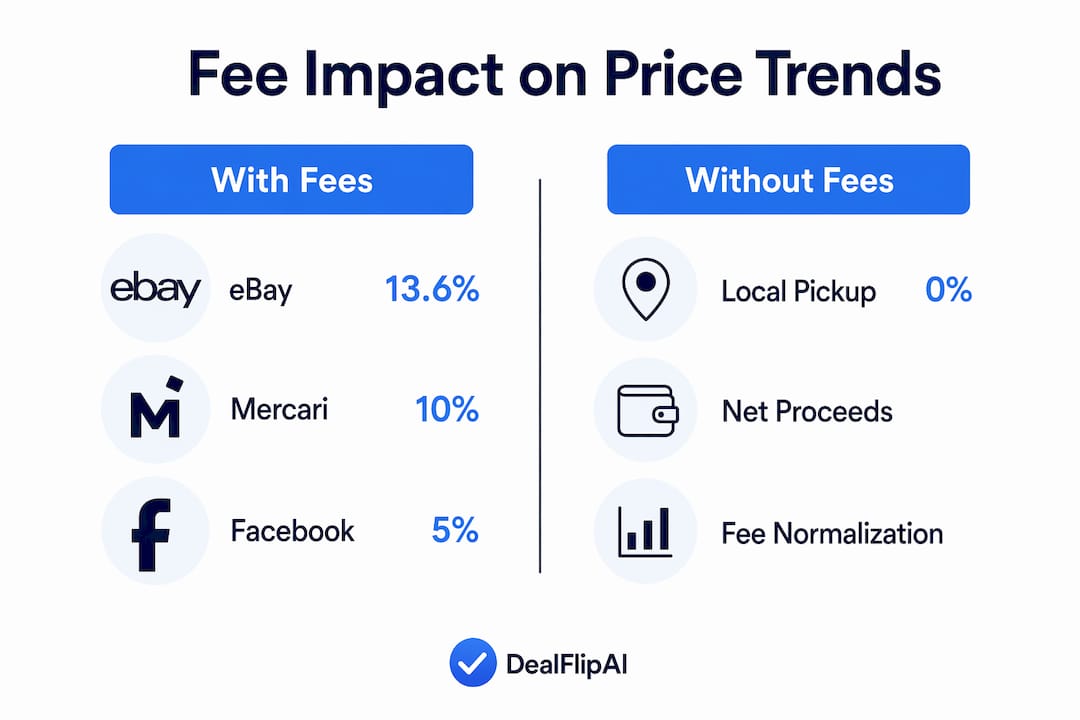
Fee normalization is the step most resellers skip, and it costs them real money. Facebook Marketplace charges zero fees for local pickup sales but applies a 5% selling fee on all shipped orders. That gap changes the net economics of every transaction you analyze.
Here is why this matters for trend reading. If you pull sold comps and mix local pickup sales with shipped sales without adjusting, you are comparing different net outcomes under the same sticker price. A $50 shipped sale nets the seller $47.50 after fees. A $50 local pickup sale nets the full $50. Treating those as equivalent distorts your trend picture.
The table below shows how fee differences affect net proceeds across common price points:
| Sale Price | Sale Type | Fee Rate | Net Proceeds |
|---|---|---|---|
| $50 | Local pickup | 0% | $50.00 |
| $50 | Shipped | 5% | $47.50 |
| $100 | Local pickup | 0% | $100.00 |
| $100 | Shipped | 5% | $95.00 |
| $200 | Local pickup | 0% | $200.00 |
| $200 | Shipped | 5% | $190.00 |
Facebook Marketplace has the lowest fees among major resale platforms. eBay charges 13.6%, Mercari charges 10%, and Poshmark charges 20%. That fee advantage makes Facebook Marketplace especially attractive for local resellers, but it also means your comp data from other platforms needs adjustment before you apply it here.
When you build a trend line, normalize every comp to its net price. Compare net-to-net, not sticker-to-sticker. Use Dealflip's shipping fee calculator to run these numbers quickly before you commit to a purchase or listing price.
Pro Tip: When your comp set mixes local and shipped sales, always convert shipped prices to their net equivalent before calculating your percentile ranges. A $100 shipped comp is really a $95 comp from the seller's perspective.
How to interpret buyer vs seller dynamics in price action
Raw price data tells you what happened. Price action interpretation tells you why and where prices are likely to go next. Techniques from technical price analysis apply directly to marketplace reselling, even without charts or indicators.
Four formations are worth understanding:
- Strong rejections: A price level where buyers repeatedly refuse to pay more. If your comp set shows three consecutive sales dropping from $120 to $95 to $80, buyers are rejecting higher prices. That is a downtrend signal.
- Weak rejections: A price level where buyers push back slightly but still transact near the top. Comps clustering between $95 and $105 with no clear drop suggest buyers and sellers are in balance.
- Fair value gaps: A sudden jump or drop in sale prices with no transactions in between. If items sold at $80 for weeks, then suddenly at $110, that gap signals a shift in demand. Watch whether subsequent sales confirm or fill that gap.
- Stop-loss clusters: Prices where sellers give up and drop fast. If you see a cluster of sold comps all priced within a few dollars of each other after a period of higher prices, sellers may be liquidating. That is a buying opportunity for resellers.
"Trend reading relies on counting evidence from multiple price action formations rather than reacting to single outliers." — trader-dale.com
When buyer and seller strength signals conflict, patience is the right move. A comp set with mixed signals does not give you a clear trend. Wait for more data before committing capital. This discipline separates consistent resellers from those who get burned chasing unclear markets.
Common pitfalls when tracking marketplace price trends
Even experienced resellers fall into predictable traps when monitoring marketplace changes. Knowing these pitfalls in advance keeps your trend reads clean.
- Relying on active listings. This is the most common mistake. Active prices are aspirational. Asking prices inflate market estimates by 30 to 80%. Never use them as your pricing anchor.
- Using stale comps. Markets move. A comp set you built three months ago may not reflect today's prices. Re-pull your comps every 14 days for any listing that has not sold. Stalled listings are an early warning sign that the market has moved against you.
- Ignoring seasonal cycles. Electronics spike before the holidays. Outdoor furniture spikes in spring. Power tools move faster in summer. Category-specific cycles create predictable market price fluctuations. Build a simple calendar of peak and off-peak periods for your top categories.
- Treating one data point as a trend. A single high sale does not confirm a rising market. A single low sale does not confirm a crash. Confirm every trend with at least three to five data points before acting.
- Mixing condition grades in your comp set. A "good" condition item and a "like new" item are not the same market. Keep your comps within the same condition tier.
Pro Tip: Set a recurring reminder every two weeks to refresh your active comp sets. If you have a listing sitting unsold, check whether recent sold prices have dropped below your list price. Adjust before the market moves further.
Practical steps to apply price trend analysis on Facebook Marketplace
Understanding market trends is only useful when it changes how you buy and list. Here is how to put your trend analysis to work:
- Set your listing price based on your time horizon. If you need to sell fast, price at the 25th percentile of your comp set. If you can wait 30 days or more, price at the 75th percentile and accept offers.
- Use Best Offer strategically. Listing at the top of your comp range and auto-accepting offers around 12% below list often nets more than pricing at the midpoint. Buyers anchor to your list price, so a higher starting point raises the final sale price even after negotiation.
- Adjust for sale type before you list. If you plan to ship, subtract 5% from your target net price to set the right sticker price. If you are selling locally, your sticker price equals your net price.
- Use stalled listings as a buying signal. When you see multiple sellers sitting on the same item with no recent sold comps, the market may be soft. That is often the best time to make a low offer and hold for a seasonal rebound.
- Run your numbers before you buy. Use Dealflip's deal finder tool to score listings against real market data before you commit. Knowing the spread between purchase price and likely sale price is the core of every profitable flip.
- Monitor your categories weekly. Ways to analyze pricing improve when you track the same categories consistently. You start to recognize normal fluctuations versus genuine trend shifts, which makes your decisions faster and more accurate.
Key takeaways
Accurate marketplace price trend reading requires sold transaction data, fee normalization, and multi-point confirmation before you act on any signal.
| Point | Details |
|---|---|
| Use sold comps only | Active listing prices overstate market value by 30 to 80%; only completed sales reveal true buyer demand. |
| Normalize for fees | Facebook Marketplace's 0% local vs 5% shipped fee gap changes net proceeds; always compare net-to-net prices. |
| Apply price action signals | Strong rejections, fair value gaps, and stop-loss clusters reveal market direction beyond raw price averages. |
| Refresh comps every 14 days | Stale data leads to mispriced listings; re-pulling comps regularly catches trend deterioration early. |
| Confirm with multiple data points | A single outlier sale is not a trend; wait for three to five consistent signals before adjusting your strategy. |
What I've learned from years of reading marketplace price data
The biggest mistake I see resellers make is treating price research as a one-time task. You pull comps before you buy, then never look again. By the time you list, the market has shifted and you are priced wrong from day one.
Fee-aware normalization changed how I read Facebook Marketplace data specifically. Once I started comparing net prices instead of sticker prices, my comp sets became far more accurate. A $100 shipped comp and a $100 local comp are not the same number. That difference compounds across dozens of transactions.
I was skeptical about applying price action concepts from trading to resale markets. But the logic holds. Buyers and sellers behave predictably at certain price levels. Recognizing a strong rejection or a fair value gap in your comp set gives you a read on where prices are heading, not just where they have been. That forward-looking perspective is what separates reactive resellers from strategic ones.
The tools available now, including Dealflip's AI-powered scoring and the free reseller calculators, remove a lot of the manual work. But the underlying skill of reading price signals still matters. Tools amplify good judgment. They do not replace it. Build the habit of disciplined, regular data review first. Then let the tools speed you up.
— Apex
How Dealflip makes price trend analysis faster and more accurate
Dealflip is built specifically for Facebook Marketplace resellers who want data-driven decisions without hours of manual research. The Facebook Marketplace Deal Finder scores listings by price, profit potential, and risk so you can spot undervalued items before other buyers do. The Value Estimator pulls real transaction data to give you an accurate market price in seconds. And the shipping fee calculator handles fee normalization automatically, so your net price comparisons are always apples-to-apples. If you want to apply everything in this article without building every comp set by hand, Dealflip is where to start.
FAQ
What is the difference between asking price and sold price?
Asking price is what a seller lists an item for. Sold price is what a buyer actually paid. Asking prices routinely overstate real market value by 30 to 80%, so sold prices are the only reliable input for price trend analysis.
How often should I update my comp set?
Re-pull your comps every 14 days for any active listing that has not sold. Markets shift faster than most resellers expect, and stale comps cause mispriced listings that sit unsold for weeks.
Does Facebook Marketplace charge fees on all sales?
Facebook Marketplace charges zero fees on local pickup sales and a 5% fee on shipped orders. This fee difference must be factored into any price comparison between local and shipped transactions.
How many sold comps do I need to identify a trend?
A minimum of five sold comps in the same condition is the standard starting point. Fewer than five data points leaves too much room for outliers to skew your read. Ten comps give you a more reliable percentile spread.
Can I use price action techniques from stock trading on marketplace reselling?
Yes. Buyer and seller strength signals like strong rejections and fair value gaps apply directly to resale markets. The same logic that explains price direction on a stock chart explains why certain items stall at specific price points on Facebook Marketplace.