

For most Facebook Marketplace flippers, practical resale investment return benchmarks focus on achieving positive net profit per flip for quick local items, higher net profit for more effortful or distant deals, and a net hourly target that varies with flipping commitment level. Net hourly is the single metric that separates profitable flippers from busy ones.
- Target net per flip: $40–$50 minimum for easy local pickups; $75–$100+ for riskier or longer-drive flips (Minimum Spread Test)
- Net hourly target: $20–$25 for casual/side-hustle flippers; $25–$35 for part-time serious flippers; $35–$50+ for full-time pro resellers
- Always hold a 20–30% reserve against hidden friction costs (no-shows, gas, prep)
- This week: run one deal through the flip-profit calculator and log five real deals with full time and cost data
Dealflip AI automates valuation and alerts so you spend less time hunting and more time closing deals that actually hit your hourly target.
Table of Contents
- What are the core resale investment return benchmarks and formulas?
- How do you calculate the true cost per deal?
- What benchmark ranges should you actually target?
- How do you measure and improve your net hourly return?
- What should your KPI dashboard track?
- How does Dealflip AI automate benchmarking and speed up decisions?
- How do benchmarks change your first-offer strategy?
- Key Takeaways
- The metric most flippers ignore until it's too late
- Dealflip AI puts your benchmarks to work automatically
- Useful sources and further reading
What are the core resale investment return benchmarks and formulas?
Every flipper needs five metrics. Here they are, clean and ready to use.
- Net profit per deal = Sale price − (Buy price + Direct costs + Friction allocation)
- Gross margin (%) = Net profit ÷ Sale price × 100
- ROI (%) = Net profit ÷ Total invested (buy price + direct costs) × 100
- Markup (%) = (Sale price − Buy price) ÷ Buy price × 100
- Net hourly rate = Net profit ÷ Total hours invested
Facebook Marketplace charges 0% on local pickup sales and 5% on shipped listings, making it the lowest-fee major selling platform for bulky local items. Compare that to eBay's roughly 13.6% final value fee, and the platform choice alone can shift your net by several dollars per deal.
Quick numeric example: You buy a Bluetooth speaker for $30, sell it for $75. Direct costs: $5 gas, $3 prep. Friction allocation (20% reserve on $37 gross): $7.40. Net profit: $37 − $7.40 = $29.60. Total time: 2 hours. Net hourly: $14.80. That deal does not meet a common hourly target used by flippers. Knowing this before committing to the trip is important.

How do you calculate the true cost per deal?
Purchase price is just the starting line. Here is the full line-item checklist for every flip:
- Buy price
- Gas and vehicle wear (round-trip)
- Drive and meetup time (valued at your hourly target)
- Inspection, cleaning, and minor repair
- Parts or batteries
- Disposal fees (if the item doesn't sell)
- Listing time and photo effort
- Shipping and packaging (if applicable)
- Payment processing or checkout fees
- Per-deal reserve for flakes and no-shows (20–30% of projected profit)
Worked example (small electronics flip):
| Cost Item | Amount |
|---|---|
| Buy price | $40–$50 |
| Prep and parts | $10 |
| Subtotal costs | $80 |
| Sale price | $95 |
| Total hours | 1 hour |
That deal fails. The worked numbers from Sidequity show a similar $40 buy / $95 sell scenario yielding roughly $49 net and $24.50/hr only when prep costs stay low and time stays under two hours total. Prep cost and no-show rate are what kill the math.
Pro Tip: Track your monthly no-show rate. If 1 in 5 buyers flakes, that's 20% of your meetup hours unpaid. Divide your total monthly no-show hours by your deals closed and add that cost to every deal's friction allocation.
What benchmark ranges should you actually target?
Segment your targets by how seriously you flip, and by category risk.
| Flipper Type | Target Net per Flip | Target Net Hourly | Weekly Deal Goal |
|---|---|---|---|
| Casual / side-hustle | $40–$50 | $20–$25 | 3–5 flips |
| Part-time serious | $60–$100 | $25–$35 | 5 flips |
| Full-time pro | $100–$300 | $35–$50+ | 10–20+ flips |
Three rules of thumb experienced flippers rely on:
- Minimum Spread Test: Require at least $40–$50 net on easy local flips; $75–$100 on anything with condition risk or a long drive.
- 3x Rule: Your target sell price should be at least 3x your buy price on small items under $30 to absorb friction.
- 20–30% reserve: Hold this back from every projected profit figure before you count the deal as a win.
Categories like mid-century furniture, power tools, and designer baby gear can produce sourcing-to-resale margins of 200–500% on top items. That ceiling is real, but it requires condition knowledge and patient sourcing. New flippers should start with $200–$500 in inventory and focus on 2–3 categories to build expertise before expanding.
How do you measure and improve your net hourly return?
Net hourly is calculated by summing net profits across a batch of deals, then dividing by total hours invested in that batch. Tracking it per category, not across all items averaged together, is what experienced resellers recommend because dissimilar categories have wildly different time profiles.
Four workflow changes that raise net hourly:
- Saved-search discipline: Set keyword alerts for your top 2–3 categories and respond within the first hour. Speed creates the sourcing edge.
- Batch pickups: Cluster meetups geographically on the same day to cut per-deal drive time.
- Pre-qualification scripts: Ask condition questions and request additional photos before committing to a meetup. This cuts no-show and wasted-trip rates.
- Category pruning: If a category consistently delivers under your hourly target after 30 days of data, pause it and reallocate time.
Cadence for reviewing metrics: Quick deal log daily (2 minutes), KPI review weekly (15 minutes), category cut or add monthly.
Pro Tip: Sort your saved-search alerts each morning by estimated net hourly, not by price. A $200 item with a 4-hour time commitment at $30/hr beats a $50 item at $12/hr every time.
What should your KPI dashboard track?
Copy this column layout into a Google Sheet or Excel file. One row per deal.
| Column | What to Enter |
|---|---|
| Date | Deal date |
| Category | Item type (electronics, furniture, tools) |
| Buy price | What you paid |
| Sell price | Final sale price |
| Direct costs | Gas + prep + parts + fees |
| Friction hours | Total hours (search, message, drive, list) |
| Reserve (20–30%) | Applied to gross profit |
| Net profit | Sale price − buy − direct costs − reserve |
| Net hourly | Net profit ÷ friction hours |
| ROI % | Net profit ÷ (buy + direct costs) × 100 |
Add conditional formatting: flag any row where net hourly falls below $15 in red. Flag any row with negative net profit in orange. Review the benchmarking method to calibrate your category thresholds.
If a category's weekly average net hourly drops below $15 for two consecutive weeks, pause sourcing in that category. That threshold is your circuit breaker.
How does Dealflip AI automate benchmarking and speed up decisions?
Dealflip AI maps directly onto the KPI dashboard you just built. Each feature handles a specific metric:
- Real-time alerts: Surface fresh listings the moment they post, so you respond before competition drives up the asking price.
- Fair-value estimator: Provides a market-based resale estimate for each listing, so you know your expected sell price before you make an offer.
- Deal breakdown: Shows expected net profit, risk signals, and condition flags for each listing, replacing manual comp research.
- Saved-search presets: Automate your category and location filters so your sourcing list is ready each morning without manual searching.
One anonymized example: a part-time flipper using Dealflip AI's alerts and deal scoring identified three high-potential electronics listings in a single morning session that each cleared a $35/hr net hourly target. Without automated scoring, two of those listings would have been passed over because the asking price looked high relative to buy price alone. The deal breakdown showed that fast turnover and low prep time made the hourly math work.
Pro Tip: Use Dealflip AI's listing analyzer before every offer. It flags repair risk and condition uncertainty, the two factors most likely to destroy your net hourly on a deal that looked clean at first glance.
How do benchmarks change your first-offer strategy?
Your target buy price is not a gut feeling. It is a formula:
Target buy price = Expected resale price − Target net − Direct costs − Friction allocation
Category examples:
- Small electronics (fast-turn): Resale $80, target net $40, costs $8, friction $10. Max buy: $22. First offer: $18–$20.
- Furniture (longer prep): Resale $250, target net $100, costs $25, friction $30. Max buy: $95. First offer: $75–$85.
- Designer baby gear: Resale $150, target net $60, costs $10, friction $15. Max buy: $65. First offer: $50–$55.
Red flags that kill the deal before you make any offer:
- Vague or filtered photos (hides condition damage)
- Seller unwilling to meet in a public place
- "Needs minor repair" with no specifics
- Missing parts not disclosed upfront
- Asking price that leaves no room for the 3x rule or your minimum net threshold
Boosting a paid listing rarely recovers margin on low-value items. Promotional spend only makes sense when it meaningfully shortens hold time on high-value inventory where the daily carrying cost is real.
Key Takeaways
Tracking net hourly per category, not gross spread, is the single most reliable way to improve your resale investment return benchmarks over time.
| Point | Details |
|---|---|
| Net hourly is the core metric | Divide net profit by total hours per deal; target $20–$25 for casual flips, $25–$35 for part-time, and $35–$50+ for full-time pro flippers. |
| Hold a 20–30% reserve | Apply this buffer to every projected profit figure to absorb no-shows, gas, and prep surprises. |
| Use the Minimum Spread Test | Require $40–$50 net on easy local flips and $75–$100 on riskier or longer-drive deals before committing. |
| Log and review weekly | Track every deal in a KPI dashboard; pause any category averaging below $15/hr for two consecutive weeks. |
| Dealflip AI automates the math | Use Dealflip AI's fair-value estimator and deal breakdown to hit your hourly target faster with less manual research. |
The metric most flippers ignore until it's too late
Most guides tell you to buy low and sell high. That advice is not wrong, it's just incomplete. The spread between buy and sell price is a vanity metric until you divide it by time.
The flippers who actually build consistent income are the ones who treat their hourly rate like a wage floor. They set a number, say $25/hr, and they walk away from any deal that doesn't clear it, regardless of how good the gross spread looks on paper. A $60 profit on a 4-hour flip is $15/hr. That's below minimum wage in most U.S. states. The deal looked great until you did the math.
What changes when you commit to hourly tracking is your sourcing behavior. You stop chasing every cheap listing and start filtering for speed: fast sellers, low-prep categories, short drives. You also start seeing your no-show rate as a real cost, not just an annoyance. Allocating that cost per deal forces you to pre-qualify buyers more aggressively, which cuts wasted trips and raises your effective hourly across the board.
The 30-day test is the fastest way to validate whether a category deserves your time. Track every serious opportunity, record projected spread and all hours, and cut anything that fails your hourly target. That discipline, more than any sourcing tip, is what separates flippers who scale from those who stay stuck.
Dealflip AI puts your benchmarks to work automatically
Knowing your target buy price and hourly floor is only half the equation. Finding listings that actually clear those thresholds, before someone else does, is where most flippers lose time.
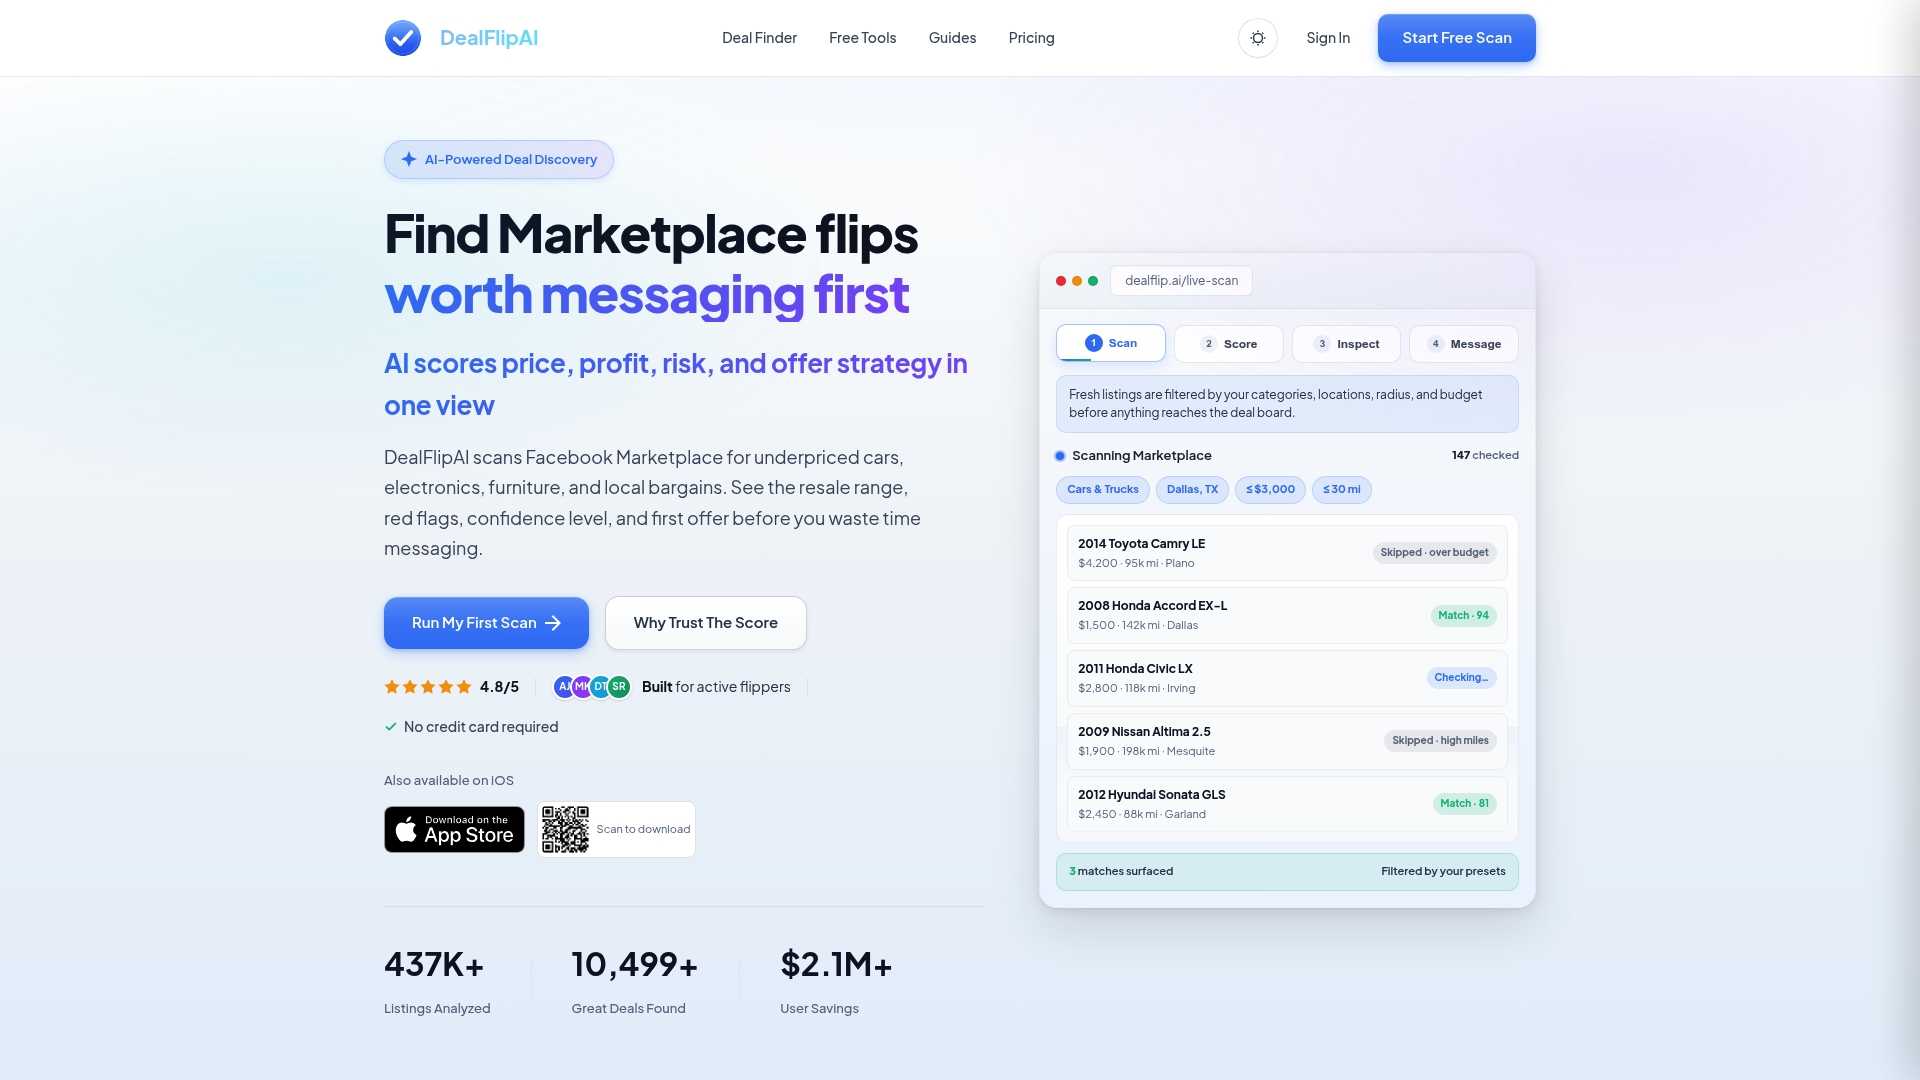
Dealflip AI scans Facebook Marketplace continuously and scores each listing against your profit targets, risk tolerance, and category preferences. The Facebook Marketplace Deal Finder surfaces only the deals that match your benchmarks, so your morning sourcing list is pre-filtered and ready. The flip-profit calculator lets you reproduce every worked example in this article on your own deals in under a minute. There's a free tier to start, no commitment required. Run one saved search this week and see how many listings actually clear your hourly target.
Useful sources and further reading
These sources back the calculations and rules in this article. Use them to verify numbers and try the calculators directly.
- Is Facebook Marketplace Still Worth It in 2026? | Underpriced: Minimum Spread Test guidance, hourly return framing, and the 30-day validation method.
- Is Facebook Marketplace Flipping Worth It? | Sidequity: Worked net-profit and net-hourly example; 20–30% reserve recommendation.
- Facebook Marketplace Flipping Calculator | Sidequity: Interactive calculator for net per flip and net hourly; useful for testing your own deal scenarios.
- Facebook Marketplace Fees 2026 | Underpriced: Fee structure breakdown (0% local, 5% shipped) and platform comparison with eBay.
- 15 Most Profitable Items to Flip | DealHunter: Category-level margin data and sourcing guidance for high-return item types.
- Flip Profit Calculator | Dealflip AI: Reproduce all worked examples and calculate your own per-deal ROI and net hourly.
- How to Benchmark Item Market Value | Dealflip AI Blog: Complements the KPI dashboard setup with market-value benchmarking methods.
- SpareDollar Blog: Additional marketplace selling strategies and pricing tools for active resellers.