

Local market demand indicators are measurable signals that reveal what products buyers actively want in a specific area right now. For resellers and investors working Facebook Marketplace, reading these signals correctly separates profitable flips from slow-moving inventory. The most reliable local market demand indicators list includes listing velocity, buyer engagement metrics, demographic growth data, and economic trend markers. Dealflip AI uses these same signals to score listings by profit potential and risk, giving resellers a real edge before they ever make an offer.
1. What is listing velocity and why does it top the local market demand indicators list?
Listing velocity is the speed at which items sell or go under contract in a given area. It is the single most actionable demand metric available to resellers because it reflects actual buyer behavior, not stated interest. Rising listing velocity signals strengthening demand 30–90 days before price changes appear, giving you a meaningful head start on the competition.
On Facebook Marketplace, you can track listing velocity manually by checking how quickly similar items move from "active" to "sold." Pay attention to how many days a listing stays up before the seller marks it sold. When that window shrinks across multiple listings in the same category, demand is building. When it stretches, demand is cooling.
Here is what to watch for when measuring listing velocity locally:
- Short days-to-sale: Items selling in under 48 hours signal high local demand.
- Rising sold counts: More "sold" badges in a category over a 30-day window confirm the trend.
- Repeat category activity: The same product type relisting quickly after selling shows sustained buyer interest.
- Thin active inventory: Few active listings paired with fast sales means supply cannot keep up with demand.
Pro Tip: Track listing velocity for the same category across two or three consecutive weeks. A single fast sale is noise. A consistent pattern is a signal worth acting on.
You can also cross-reference listing velocity with already-sold listings on the platform to confirm which categories are clearing fastest in your zip code.
2. Buyer engagement metrics: message volume, inquiries, and price cuts
Buyer engagement metrics reveal how many people are actively interested in a product, not just browsing past it. Message volume and inquiry counts show real curiosity. When a listing collects multiple messages within hours of posting, that item has demand. When it sits for days without a single inquiry, the market is telling you something equally clear.

Price cuts are a different kind of signal. A seller who drops the price within the first week is responding to weak demand or heavy competition. Tracking recent price reductions across a category gives you a read on whether buyers have the upper hand. That is useful information when you are deciding whether to source more of a particular item.
Here is a practical breakdown of what each metric tells you:
- High message volume: Strong buyer interest; the item will likely sell at or near asking price.
- Multiple offers reported: Competitive demand; sellers hold firm on price.
- Rapid price cuts: Soft demand or oversupply; avoid sourcing more of this item right now.
- Zero inquiries after 72 hours: Low local demand; the category may be saturated or seasonally weak.
Search volume signals early-stage buyer curiosity but does not always convert to actual sales. That distinction matters. Attention is not the same as purchase activity, so always pair search interest data with actual transaction signals before committing to a sourcing decision.
Pro Tip: Use the SERPView blog's analysis of search data insights to identify rising product categories, then validate those trends against local engagement metrics before buying inventory.
3. Using demographic and economic trends as demand multipliers
Demographic data does not tell you what sold last Tuesday. It tells you whether a neighborhood's buying power is growing or shrinking over time. That context makes every other indicator more reliable. Population growth, income levels, and employment trends act as multipliers that enhance demand evaluation accuracy across all your other metrics.
The U.S. Census Bureau and the American Community Survey publish this data at the zip code level for free. Net migration into an area increases the pool of buyers who need household goods, electronics, and furniture. Rising median income signals that buyers can pay closer to asking price. Strong local employment numbers reduce the risk that demand will evaporate between your purchase and your sale.
| Demographic Indicator | What It Signals | Best Data Source |
|---|---|---|
| Net population growth | Expanding buyer pool | U.S. Census Bureau |
| Rising median household income | Higher willingness to pay | American Community Survey |
| Low unemployment rate | Stable buying power | Bureau of Labor Statistics |
| Net in-migration | Increased demand for household goods | Census Bureau migration data |
Combine these demographic signals with your listing velocity and engagement data. A neighborhood showing strong in-migration and fast listing velocity is a high-confidence sourcing zone. Either signal alone is interesting. Both together is a buying signal.
4. How to combine multiple local demand indicators effectively
No single indicator gives you the full picture. Triangulating demand across per-capita consumption patterns, engagement rates, and comparable sales data produces defensible estimates that single-method analysis cannot match. Resellers who rely on one metric alone routinely misread seasonal spikes as sustained demand.
Investors use dashboards integrating four or more indicators to validate demand signals and reduce errors from seasonal or isolated anomalies. A typical dashboard tracks listing velocity, message volume, recent price cuts, and demographic growth together. When all four point in the same direction, confidence in the opportunity is high. When they conflict, that is a reason to pause.
Here is a practical framework for combining your indicators:
- Set a velocity threshold. Only pursue categories where items sell in under 72 hours on average.
- Confirm with engagement. Look for listings that show multiple inquiries or reported offers.
- Check price stability. Avoid categories where sellers are cutting prices within the first week.
- Layer in demographics. Prioritize zip codes with positive net migration and rising income.
- Score the opportunity. Weighted scoring models assign roughly 25% weight each to market demand and financial viability. Opportunities scoring above 7.5 out of 10 on a combined scale indicate strong potential. Those scoring below 6 should be passed.
Pro Tip: Build a simple spreadsheet tracking these five signals for your top three product categories. Review it weekly. Patterns emerge faster than you expect, and you will start catching demand shifts before prices move.
Dealflip AI automates much of this process by scoring Facebook Marketplace listings against real-time market data, so you spend less time building spreadsheets and more time making offers. You can also review fastest-selling categories to see which product types are clearing fastest right now.
5. Timing your sourcing decisions with market trend indicators
Timing is where most resellers leave money on the table. Knowing what is in demand is only half the equation. Knowing when to buy determines your margin. Demand projections often overestimate speed because resellers ignore execution constraints like pickup logistics, cleaning time, and relisting delays. Those gaps eat into your profit window.
The practical fix is to build a sourcing calendar based on your local demand signals. When listing velocity in a category starts accelerating, that is your cue to source aggressively. When it plateaus, slow down. When it drops, stop. This rhythm keeps your inventory aligned with actual buyer activity rather than gut instinct.
Market timing affects both your purchase price and your sale price. Buying during a demand dip and selling during a velocity spike is the core profit mechanic for experienced flippers. The indicators in this list give you the data to execute that mechanic reliably.
Key takeaways
The most reliable local market demand indicators combine listing velocity, buyer engagement, and demographic data into a multi-signal dashboard that reduces sourcing risk and improves timing on profitable resale decisions.
| Point | Details |
|---|---|
| Listing velocity leads all indicators | Items selling in under 72 hours signal strong local demand worth acting on. |
| Engagement metrics confirm buyer intent | High message volume and multiple offers validate what velocity data suggests. |
| Demographics multiply signal reliability | Net migration and rising income confirm that demand is structural, not seasonal. |
| Multi-indicator dashboards reduce errors | Tracking four or more signals together filters out noise and seasonal spikes. |
| Weighted scoring guides go/no-go decisions | Opportunities scoring above 7.5 on demand and viability scales show strong potential. |
Why I trust absorption rate over everything else
Walsh Pex here. After years of analyzing resale markets, I have come to one firm conclusion: absorption rate, which is just another name for listing velocity, beats every other demand metric for practical reselling decisions. Search volume looks impressive in a report. Stated preference surveys sound scientific. Neither tells you what buyers actually did with their money last week.
The resellers I have seen struggle most are the ones who chase trending search terms without checking whether those searches convert to local sales. A product can trend nationally while sitting unsold in your city for three weeks. That gap between curiosity and conversion is where money disappears.
My honest recommendation for 2026 is to build your demand assessment around revealed preference data, meaning actual sales activity, and treat search volume as a secondary curiosity signal. Check your local absorption rate weekly. Layer in demographic context from the Census Bureau quarterly. And when all your signals align, move fast. The window between a demand signal and a price adjustment is real, but it is not wide.
The resellers who win consistently are not the ones with the best instincts. They are the ones with the best systems.
— Walsh Pex
Dealflip AI puts these demand signals to work for you
Dealflip AI is built specifically for resellers who want to act on local demand data without spending hours building spreadsheets. The platform scores Facebook Marketplace listings by profit potential, price accuracy, and risk factors in real time, so you see which deals are worth pursuing before anyone else does.
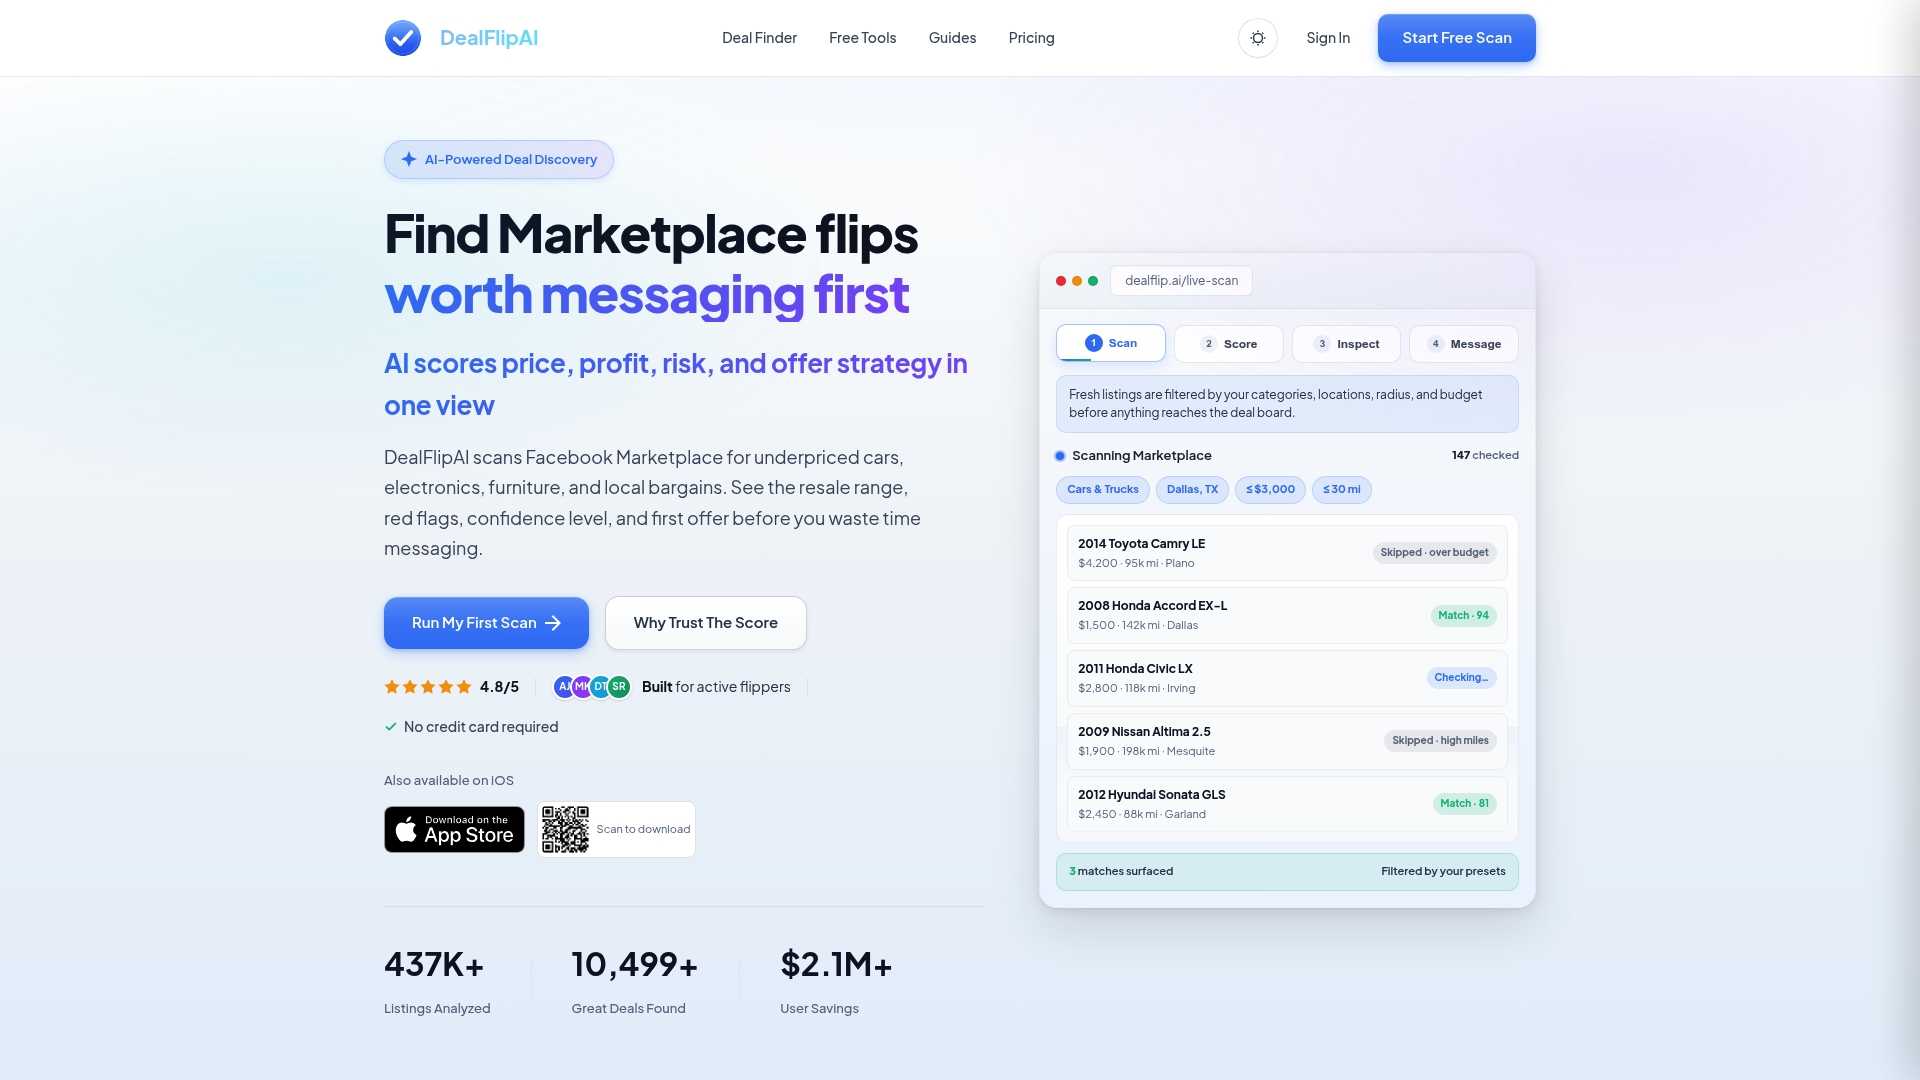
The free listing analyzer tool evaluates individual listings against current market data, giving you a clear read on demand and resale value in seconds. The flip profit calculator shows your expected margin before you commit to a purchase. Dealflip AI also flags scam listings and sends real-time alerts when high-potential items appear in your target categories. If you want to find good deals on Facebook Marketplace faster and with more confidence, Dealflip AI gives you the data to do it.
FAQ
What is the most reliable local demand indicator for resellers?
Listing velocity, the speed at which items sell in a local market, is the most reliable demand indicator. It provides signals 30–90 days before price trends shift, giving resellers a meaningful timing advantage.
How do I measure listing velocity on Facebook Marketplace?
Track how quickly similar items move from active to sold in your target category over two to three consecutive weeks. A consistent pattern of short days-to-sale confirms genuine local demand rather than a one-off spike.
Why is search volume alone not enough for demand assessment?
Search volume reflects curiosity, not purchase intent. A product can attract high search interest nationally while selling slowly in your specific local market, so always pair search data with actual transaction signals.
How many indicators should I track at once?
Track at least four indicators together: listing velocity, message volume, recent price cuts, and demographic growth. Monitoring multiple complementary indicators builds confidence in your read of local demand and filters out seasonal noise.
Where do I find free demographic data for local market analysis?
The U.S. Census Bureau and the American Community Survey publish population, income, and employment data at the zip code level at no cost. These sources give you the demographic context needed to assess whether local buying power is growing or contracting.