

Demand signals are real-time indicators of market interest, scarcity, and buyer behavior that directly shape how you should price items for sale. The role of demand signals in sell pricing is to tell you what buyers are willing to pay right now, not what they paid last month. Resellers and flippers who read these signals correctly set prices that capture maximum margin. Those who ignore them either leave money on the table or sit on inventory too long. Dealflip AI uses these exact signals to score listings and suggest optimal offer prices on Facebook Marketplace, giving you a data edge before you even make a move.
What types of demand signals are most relevant to sell pricing?
Demand signals fall into two broad categories: behavioral signals and structural signals. Behavioral signals come from buyers, including search volume, listing views, message volume, and click-through rates. Structural signals come from the market itself, including inventory levels, competitor pricing moves, and sales velocity.
Real-time demand signals like search volume and click-through rates can improve forecast accuracy by 20–35%. That improvement translates directly into better pricing decisions and fewer unsold items.
The most useful signals for resellers include:
- Sales velocity: How fast similar items are selling in your category
- Listing view spikes: A sudden jump in views signals rising buyer interest
- Message volume: More inquiries mean more competition among buyers
- Inventory scarcity: Fewer comparable listings push prices up
- Competitor price moves: Drops signal weakening demand; increases signal strength
- Search trend data: Rising search volume for a product type precedes price increases
Not every spike is meaningful. A viral social media post can flood a listing with views for 48 hours, then vanish. That is a transient spike, not a sustained demand shift. You need to see a signal confirmed across at least two sources before acting on it. A spike in views combined with rising message volume is a real signal. Views alone may be noise.
Pro Tip: Cross-check listing view spikes with search trend data before raising your price. One signal is a hint. Two signals aligned is a reason to act.
How do demand signals drive dynamic pricing decisions?
Dynamic pricing is the practice of adjusting sell prices in response to real-time market conditions rather than setting a fixed price and waiting. It is the mechanism that turns raw demand signals into actual price changes.

Dynamic pricing strategies can increase revenue by 12.3%, but they also correlate with an 8.7% increase in cart abandonment. That tradeoff is the central tension every reseller must manage.
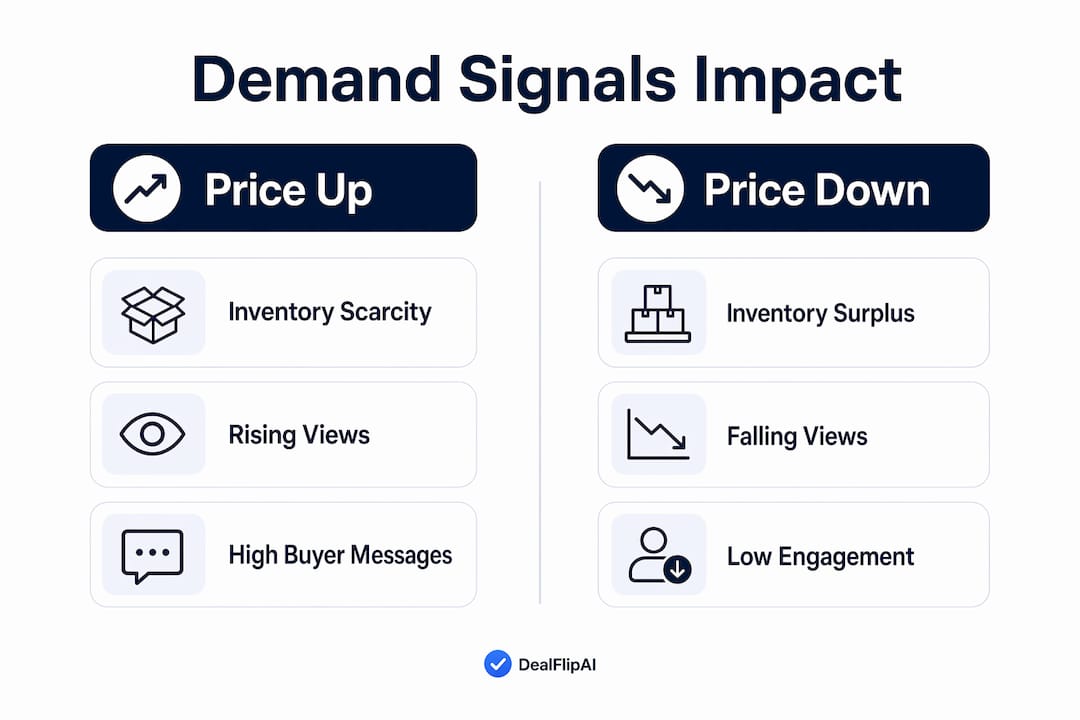
The table below shows which demand signals push prices up and which signal a need to adjust down.
| Signal | Price direction | Why it matters |
|---|---|---|
| Inventory scarcity | Up | Fewer alternatives mean buyers accept higher prices |
| Rising listing views | Up | More buyers competing for the same item |
| High message volume | Up | Strong buyer intent signals willingness to pay more |
| Competitor price drops | Down | Buyers shift to cheaper alternatives |
| Stagnant sales velocity | Down | Demand is weakening relative to supply |
| Promotional distortion | Neutral | Spike is artificial; wait before adjusting |
The reference price effect explains why abrupt price jumps backfire. Buyers carry an internal expectation of what an item should cost. When your price exceeds that expectation sharply, they abandon the listing even if demand is genuinely strong. Gradual increases of 5–10% over several days preserve buyer trust while still capturing margin.
Pro Tip: Raise prices in small increments when demand signals strengthen. A $20 jump on a $150 item feels fair. A $60 jump feels like a scam, and buyers will say so in reviews.
Understanding buy signals in trading follows a similar logic. Buyers and traders both respond to perceived value relative to current market conditions, not absolute price.
What nuances must resellers understand when reading demand signals?
Reading demand signals correctly requires category context. Price sensitivity varies by category: electronics show higher price elasticity at -1.72 compared to fashion at -0.89. That means a 10% price increase on an electronics item drives away nearly twice as many buyers as the same increase on a fashion item. You cannot apply one pricing rule across all categories.
Promotions and inventory distortions create false demand signals that mislead resellers into poor pricing decisions. A competitor running a flash sale drops their price, which looks like weakening demand. But it is a temporary promotional move, not a structural shift. Acting on it by cutting your own price costs you margin for no reason.
Common pitfalls and best practices for signal interpretation:
- Pitfall: Reacting to a single-day view spike without confirming with message volume
- Pitfall: Cutting prices when a competitor discounts during a known sale event
- Pitfall: Ignoring regional demand differences on platforms like Facebook Marketplace
- Best practice: Track sales velocity over 7-day windows, not single days
- Best practice: Compare your listing's view-to-message ratio against your category average
- Best practice: Check whether inventory levels in your area are rising or falling before adjusting price
Inventory speed is a more reliable demand signal than competitor prices alone. If your item is not moving despite competitive pricing, the problem is likely listing quality, not price. Improving your photos and description often outperforms a price cut.
Multi-channel resellers face an added layer of complexity. Demand on Facebook Marketplace can diverge sharply from demand on eBay for the same item. Local buyers have different price expectations than national buyers. Always evaluate signals within the specific platform and region where you are selling.
How can resellers apply demand signals to maximize sell pricing?
Applying demand signals to pricing is a repeatable process, not a one-time judgment call. Here is a practical workflow you can follow for every listing.
- Detect the signal. Monitor listing views, message volume, and sales velocity for the first 48–72 hours after posting. A spike in views or messages within the first day is your first data point.
- Validate the signal. Cross-check with at least one other source. Check whether comparable listings in your area are selling faster or slower. Look at search trend data for the product category.
- Decide on action. If two or more signals confirm rising demand, hold your price or raise it incrementally. If signals point to weakening demand, improve your listing quality before cutting price.
- Execute gradually. Adjust price in small steps. Monitor buyer response after each change. A price increase that kills message volume tells you the market ceiling.
- Refine over time. Keep a simple log of which signals preceded successful sales at strong margins. Patterns emerge quickly across 10–20 transactions.
Demand spikes in listing views or inquiries signal opportunities to hold or increase prices, not to accept low offers. Resellers who immediately accept the first offer during a view spike leave margin behind.
Dealflip AI automates steps one and two by scoring listings based on price, profit potential, and real-time market signals. Its AI offer suggestion tool calculates optimal first offers using current demand and seller behavior data. That removes the guesswork from the detect-and-validate phase.
Pro Tip: Test a 5–8% price increase when you see a view spike. If message volume holds steady or rises, the market supports the new price. If messages stop, you found the ceiling.
You can also use the market demand guide to build a deeper understanding of how demand cycles affect reselling profits across different product categories.
Key Takeaways
Demand signals are the most reliable real-time input you have for setting sell prices that reflect true buyer willingness to pay, and acting on them systematically separates profitable resellers from those who consistently undercharge or overprice.
| Point | Details |
|---|---|
| Validate before acting | Confirm signals across two sources before changing your price. |
| Category elasticity matters | Electronics buyers are twice as price-sensitive as fashion buyers. |
| Inventory speed beats competitor price | Slow sales often signal a listing quality problem, not a price problem. |
| Gradual increases protect trust | Small price steps capture margin without triggering buyer abandonment. |
| Spikes mean hold, not sell | Rising views and messages are a reason to raise price, not accept low offers. |
Why most resellers misread demand signals
Most resellers I have worked with make the same mistake: they treat every demand signal as urgent and act immediately. A listing gets 40 views in one afternoon and they panic, either dropping the price to close fast or raising it so sharply that buyers disappear. Neither response is disciplined.
The real skill is patience combined with pattern recognition. The challenge is not detecting demand signals but deciding which ones are real versus temporary noise. Procter & Gamble, one of the most sophisticated supply chain operators in the world, built an entire discipline around this exact problem. Resellers face the same challenge at a smaller scale.
What I have found works is treating the first 72 hours of a listing as a data collection window, not a sales window. You are not trying to close a deal. You are watching how the market responds to your price. That data tells you whether to hold, raise, or improve the listing.
AI tools have changed this significantly. Dealflip AI gives individual resellers access to the kind of signal analysis that used to require spreadsheets and hours of manual research. The listing analyzer tool reads market signals and scores listings in real time, which means you spend less time guessing and more time acting on confirmed data.
The resellers who consistently protect their margins are not the ones with the best instincts. They are the ones with the most disciplined process for reading and responding to what the market is actually telling them.
— Walsh Pex
Dealflip AI puts demand signal analysis in your hands
Pricing a listing correctly requires real-time data, not gut feeling. Dealflip AI reads market signals across Facebook Marketplace listings and translates them into concrete pricing recommendations. Its scoring system evaluates price, profit potential, and risk factors so you know exactly where a deal stands before you commit.

The cross-listing profit calculator shows you how demand and fees interact across eBay, Mercari, and Poshmark, so you can pick the platform where your margin is strongest. The flip profit calculator factors in your buy price, fees, and expected sell price to show your real return. Both tools are free and built specifically for resellers who want data behind every pricing decision.
FAQ
What are demand signals in sell pricing?
Demand signals are real-time indicators of buyer interest and market scarcity, including listing views, message volume, sales velocity, and search trends. They tell sellers what buyers are willing to pay right now.
How do demand signals affect pricing in marketplaces?
Strong demand signals like rising views and low inventory justify holding or raising prices. Weak signals like stagnant sales velocity suggest improving listing quality before cutting price.
What is the biggest mistake resellers make with demand signals?
The most common mistake is acting on a single signal without validation. A view spike alone is noise. A view spike combined with rising message volume is a confirmed signal worth acting on.
How does price elasticity change how you use demand signals?
Electronics have higher price elasticity than fashion, meaning electronics buyers respond more sharply to price increases. You need to apply smaller price adjustments in high-elasticity categories.
How does Dealflip AI help resellers use demand signals?
Dealflip AI scores listings using real-time market signals and suggests optimal offer prices based on current demand and seller behavior. It automates the detect-and-validate phase of demand signal analysis.