

The deal risk-reward ratio is a reseller's go-to metric: expected net resale profit (after every cost, fee, and hour of your time) divided by the quantified downside if the deal goes wrong. For Facebook Marketplace flippers, the decision rule is simple. Buy when your ratio clears 2.0 or higher and your Maximum Allowable Offer (MAO) check passes. Walk when it doesn't. Tools like Dealflip AI automate the math and flag scam signals before you ever message a seller, while frameworks like the BiggerPockets flip calculator give you a structured template for itemizing every cost.
The ratio isn't the same as the trader's risk-reward concept you'll find in investing guides. For resellers, it's purely about whether a specific listing will put real dollars in your pocket after every cost is counted, and whether the risks you're taking are proportionate to that return.
Table of Contents
- How do you calculate the risk-reward ratio for a resale deal?
- What quick-screen rules help you triage listings fast?
- How do you score downside risk and fold it into the ratio?
- Worked example: a Facebook Marketplace electronics flip
- Your buy/offer/walk checklist and offer strategy
- Which tools speed up the screening workflow?
- Key Takeaways
- The number most flippers ignore
- Dealflip AI does the ratio math for you
- Useful sources and calculators
How do you calculate the risk-reward ratio for a resale deal?
Start with two formulas. First, net profit:
Net Profit = Resale Price − (Purchase Price + All Costs)
Then the ratio itself:
Risk-Reward Ratio = Expected Net Profit ÷ Estimated Downside Loss
Every cost component matters. Here's what goes into "All Costs" for a U.S. Marketplace flipper:
- Platform fees: Facebook Marketplace charges 5% on shipped sales and nothing on local pickup. Poshmark charges 20%. That gap changes your take-home significantly on the same item.
- Shipping and transport: Gas, mileage, or actual shipping labels. Use Dealflip AI's shipping fee calculator to get a real number fast.
The BiggerPockets flip calculator uses After Repair Value (ARV) as the resale anchor, subtracting rehab, holding, financing, and selling fees to land on net profit and MAO. The same logic applies to Marketplace items: your ARV is the price comparable sold listings actually cleared, not the asking price.
Pro Tip: Always add a repair contingency line, even for items that look clean. A $150 vintage blender with a seized motor just became a $0 resale.
What quick-screen rules help you triage listings fast?
You don't need a spreadsheet for every listing. A 30–60 second scan using a few filters will eliminate most bad deals before you invest more time.
The Marketplace 70% adaptation: For local pickup flips, a quick MAO estimate is: (Sold Comp Price × 0.70) − Estimated Repair Cost. If the listing price is above that number, the deal needs a strong justification to proceed. The HouseFlipCalc 70% rule was built for real estate, but the logic transfers: it's a fast screen, not a final answer.
Numeric thresholds to set before you scroll:
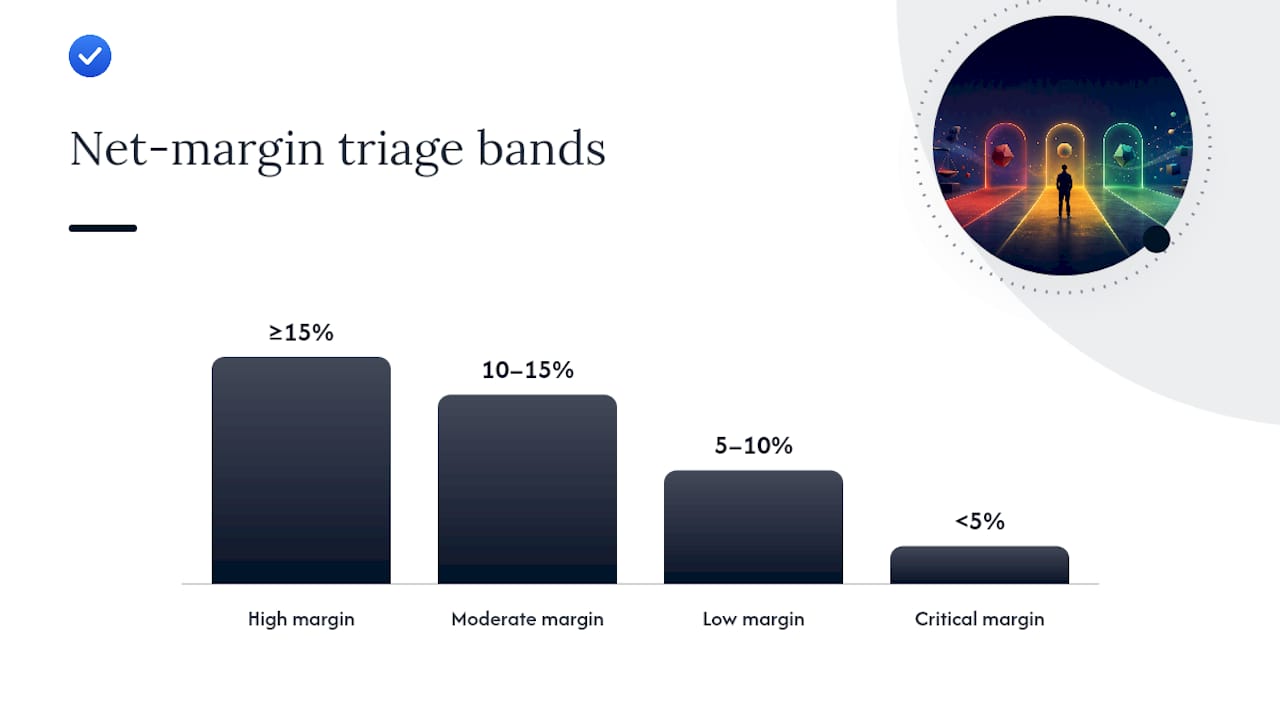
- Minimum net margin: a high margin is excellent (15%+), a moderate margin is good (10–15%), a low margin is concerning (5–10%), and below 5% is critical per ArvCalc's margin bands.
- Minimum absolute profit: Set a floor, like $40 net for small items, $150+ for furniture or electronics.
- Days-to-sell target: Electronics typically sell faster than furniture, which can take several weeks; factor that into your hold cost.
Red flags that should stop your scroll:
- Seller uses urgency language ("must sell today," "moving tomorrow")
- No meeting location listed or refuses local pickup
- Stock photos instead of actual item photos
- Listed price swings wildly from sold comps (50%+ below market with no explanation)
- New account with no reviews or profile history
Knowing market values is your best scam defense. Verifying sold comps quickly and checking seller profile details reduces pressure and flags unrealistic listings before you waste a trip.
How do you score downside risk and fold it into the ratio?
Quantifying risk turns a gut feeling into a number you can actually use. Score each deal on three axes, 1 (low) to 5 (high):
| Risk Axis | Score 1 (Low) | Score 3 (Medium) | Score 5 (High) | Effect on MAO |
|---|---|---|---|---|
| Fraud/scam likelihood | Verified seller, clear photos | New account, vague details | No pickup, stock photos | Walk at score 4+ |
| Repair/hidden damage | Item tested, clean condition | Minor wear, untested | No photos of internals | Add 20–30% repair buffer |
| Liquidity/turnover | Fast-moving category | Seasonal or niche item | Oversupplied or obscure | Extend hold time estimate |
Convert scores into expected loss: multiply your estimated loss if the deal goes wrong by the probability that scenario occurs. A $200 purchase with a 20% chance of a $150 loss (hidden damage) adds $30 to your downside figure.
Sensitivity analysis in three steps:
- Run your base-case net profit calculation.
- Increase repair cost by 20% and recalculate.
- Extend hold time by one to two weeks and add the carrying cost.
If the ratio drops below 1.5 under either stress scenario, the deal has thin margins. FinToolSuite's flip calculator makes this kind of annualized ROI sensitivity easy to visualize: the same dollar profit on a 3-week flip beats a 10-week flip by a wide margin once you account for time and capital tied up.
Worked example: a Facebook Marketplace electronics flip
Listing: Sony WH-1000XM4 headphones, listed at $120. Sold comps on eBay average $185 (used, good condition).

| Input | Amount |
|---|---|
| Purchase price | $79.00 |
| Time cost (1.5 hrs × $20/hr) | $40 |
| Net profit | $185 − $120 − $66.05 = −$1.05 |
At asking price, this deal barely breaks even once time is counted. Calculate your MAO to meet your net profit target; if the seller won't negotiate below this price, it's a walk.
Risk scoring for this listing: Fraud risk = 2 (established seller profile), repair risk = 2 (seller shows working demo video), liquidity = 1 (fast-moving category). Expected loss = low. Adjusted ratio at $79 purchase: Net profit $40 ÷ Expected loss $15 = 2.67. That clears the 2.0 threshold.
Sensitivity rows:
| Scenario | Net Profit | Ratio |
|---|---|---|
| Base case ($79 purchase) | $40 | 2.67 |
| +20% repair ($6 more) | — | 2.67 |
| +2 weeks hold (extra $10 time) | $40 | 2.0 |
Your buy/offer/walk checklist and offer strategy
Before you send a message, run through this sequence:
- Confirm sold comps from at least three recent sales (not asking prices).
- Calculate MAO using the full cost stack above.
- Score the three risk axes and compute expected loss.
- Check ratio: if it's below 2.0 under base case or below 1.5 under stress, walk.
- Set your first offer at MAO minus 10–15%. On the Sony example, MAO is $79, so first offer is $67–$71.
- Set your walk price at MAO. Never pay above it.
- Plan your inspection: test the item before handing over cash. For electronics, bring a phone or laptop to verify Bluetooth pairing.
- Use safe payment: cash for local pickup, or PayPal Goods & Services for any shipped transaction.
Red flags that trigger an immediate walk, regardless of ratio:
- Seller refuses in-person meeting or insists on shipping only for a local listing
- Serial numbers don't match the model described
- Photos change between messages (different unit being shown)
- Seller asks for Zelle, Venmo, or gift cards only
Which tools speed up the screening workflow?
A three-step workflow keeps analysis under five minutes per listing:
- Detailed input: Run the full cost stack through a flip profit calculator or Dealflip AI's listing analyzer to get net profit, margin, and MAO.
Tools that map directly to ratio inputs:
- Sold comps: eBay "Sold" filter, Facebook Marketplace sold listings, or Dealflip AI's value estimator for cross-platform comps.
- Fee calculation: Dealflip AI's PayPal fee calculator and platform-specific fee guides.
- Tracking profit over time: Bookkeeping discipline separates guessing from knowing. Tracking every purchase and sale reveals which categories are genuinely profitable and which eat your time.
Dealflip AI's real-time deal alerts surface fresh listings before most flippers see them, which protects your margin. The best deals disappear in hours.
Pro Tip: Set category and location presets in Dealflip AI once, and let the alerts come to you. Spending less time searching means more time evaluating deals that actually clear your thresholds.
Key Takeaways
The deal risk-reward ratio gives you a single number to decide buy, offer, or walk on any Marketplace listing, once every cost and risk is counted.
| Point | Details |
|---|---|
| Core formula | Net Profit = Resale − (Purchase + All Costs); Ratio = Net Profit ÷ Estimated Downside Loss. |
| Target threshold | Aim for a ratio of 2.0 or higher; below 1.5 under stress testing is a walk. |
| Margin bands | 15%+ net margin is excellent; 10–15% is good; 5–10% is concerning; below 5% is critical. |
| Time is a real cost | Value your hours at a realistic rate and include them in every deal calculation. |
| Dealflip AI | Automates comps, fee math, scam detection, and offer suggestions so you can screen more deals in less time. |
The number most flippers ignore
Most flippers obsess over the spread between asking price and sold comps. That's understandable. It's the most visible number. But the spread is not profit, and treating it as profit is the single most common reason a flip that looked great on paper ends up breaking even or losing money.
The real insight from building a proper risk-reward ratio isn't the formula itself. It's that the process forces you to confront your time cost honestly. A $30 net profit on a $60 purchase looks like a 50% return until you count two hours of sourcing, cleaning, and listing. At $20/hour, you just worked for free.
The flippers who scale past side-hustle income aren't the ones who do more deals. They're the ones who get ruthless about which deals clear their threshold and walk confidently on everything else. A ratio below 2.0 isn't a negotiation starting point. It's a no.
Dealflip AI's scoring and scam detection features make that discipline easier to maintain at volume, because the math happens before you've emotionally committed to a listing.
Dealflip AI does the ratio math for you
Spending 20 minutes calculating a ratio on every listing isn't realistic when you're screening dozens a day. Dealflip AI scans Facebook Marketplace listings, estimates net profit using cross-platform sold comps, scores fraud and damage risk, and suggests your first offer, all before you message the seller.

The listing analyzer maps directly to every field in the ratio: resale value, platform fees, repair risk, and scam signals. The flip profit calculator lets you stress-test assumptions in seconds. Both tools are available on a free plan with no credit card required.
If you want to find good deals on Facebook Marketplace faster and with less guesswork, start with Dealflip AI's free tools and run the Sony headphones example through the listing analyzer to see how the numbers land.
Useful sources and calculators
- House Flipping Investing Calculator
- ArvCalc house-flipping profit calculator
- HouseFlipCalc
- FinToolSuite property flip profit calculator
- Is Item Flipping Worth It? Profit Calculator Guide | UseACalculator.com
- How to Avoid Scams on Facebook Marketplace as a Reseller | FlipChecker