

Serious investors track resale performance with a compact KPI dashboard that combines liquidity signals (completed sales, days-on-market) with realized-price tracking and true margin after fees. You can start right now by doing these four things: capture every realized sale price, compute your sell-through rate for the past 30 days, flag any item that has been sitting unsold for more than 10 months, and log all fees and shipping costs per flip. Dealflip AI can automate most of this workflow once your data capture is in place.
Table of Contents
- How do investors track resale performance? The core KPIs
- How to build a resale performance dashboard from scratch
- How do you interpret benchmarks and spot red flags?
- Which tools and workflows actually work for resellers?
- Monthly report template you can copy right now
- How to protect your data from scams and bad records
- Key Takeaways
- Why monthly KPI discipline changes everything
- Dealflip AI puts your resale dashboard on autopilot
- Useful sources and further reading
How do investors track resale performance? The core KPIs
The ground truth in resale investment tracking is the realized sale price, not the asking price. Realized listing-based data from millions of used-item listings shows that asking prices routinely mislead buyers about true market value. Serious investors base purchase offers on realized sales to avoid buying at inflated asking-price levels that destroy margins.
Here are the KPIs that belong on every flipper's dashboard:
- Completed sales vs. asking price gap: The spread between what sellers ask and what buyers actually pay tells you how negotiable a category is.
- Sell-through velocity: Sold units divided by average active listings in a period. A low rate signals weak demand or overpriced inventory.
- Days-on-market (DOM): On Facebook Marketplace, track from listing date to "marked sold." Rising DOM with flat or falling prices is an early warning sign.
- Realized margin / ROI per flip: Net proceeds minus acquisition cost, fees, shipping, and any refurbishment. This is your true return.
- Gross margin per flip: Realized sale price minus acquisition cost only, before fees. Useful for comparing categories before adding channel costs.
- Transaction costs and platform fees: Hidden costs like packaging and shipping labels often turn a good-looking deal into a thin-margin flip. Always compute true margin by channel.
Market-quality indicators matter too. Tighter bid-ask spreads and shorter transaction times signal durable demand rather than a temporary price spike. When buyers and sellers are far apart on price and deals take weeks to close, that category is losing depth.
Pro Tip: No single metric tells the whole story. A high sell-through rate with shrinking realized margins means you are moving product but losing ground. Always read at least three KPIs together before making a sourcing decision.
"Combine liquidity metrics, price movement tracking, and operational signals in a dashboard rather than relying on any single indicator." — Azimira investor guidance
How to build a resale performance dashboard from scratch
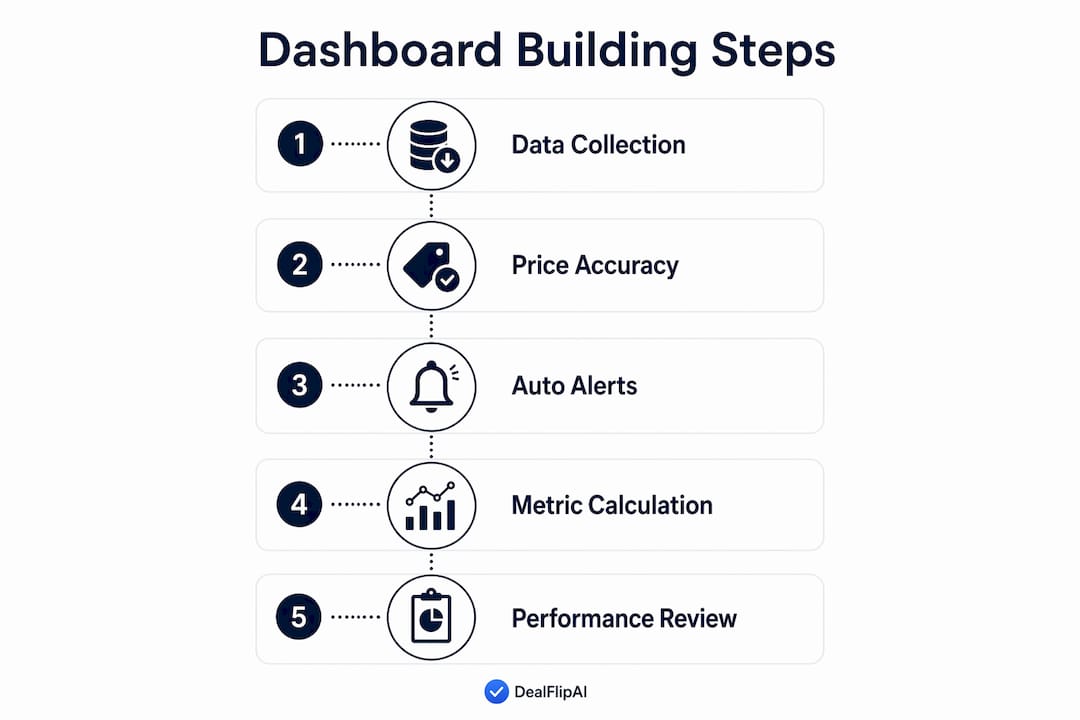
Start small: a dashboard with six to eight widgets covers everything you need. Build it around completed sales, DOM, sell-through rate, realized margin, fees per channel, and aged-stock percentage. A one-page operations dashboard with those views is enough to catch problems early and make better sourcing decisions.
Step-by-step setup:
- Capture every listing. Record the item name, category, acquisition cost, listing date, and asking price at the time you list.
- Log the realized sale price and settlement date. This is the single most important field. Never substitute asking price here.
- Tag all costs. Shipping, packaging, repairs, and platform fees get their own columns. Don't lump them together.
- Reconcile platform fees weekly. Match settlement files against your internal logs to catch missing or duplicate records before they distort your monthly numbers.
- Mark buyer repeat IDs where available. Hashed or anonymized identifiers help you spot repeat buyers, which is a signal of category loyalty.
- Run your monthly performance report. Pull portfolio-level KPIs once a month and compare against your prior period.
Data sources to ingest:
| Source | What it provides | Refresh cadence |
|---|---|---|
| Facebook Marketplace exports / screenshots | Listing dates, asking prices, item details | Daily |
| Messaging receipts | Realized sale price confirmation | Per transaction |
| Shipping / label records | True shipping cost per flip | Per transaction |
| Platform settlement CSVs | Net payout, fees deducted | Weekly reconciliation |
| Manual cost log | Packaging, repairs, acquisition cost | Per transaction |

Pro Tip: Get realized sale prices and settlement dates right before you add any derived metrics. A dashboard built on estimated or asking-price data will mislead you every single month.
Deal alerts can feed fresh listings into your tracking system automatically, cutting the manual capture step significantly.
How do you interpret benchmarks and spot red flags?
Benchmarks depend on category and season, but certain red flags are universal. A high-turn category like consumer electronics might see DOM under 14 days and sell-through above 60% in a healthy market. A slow-turn category like furniture might see DOM of 30–45 days and sell-through of 25–35% and still be performing well. Use these as rough orientation bands, not hard rules, and check local demand indicators to calibrate for your specific market.
Red flags that require action:
- Asking-to-realized price gap widening by more than 15% over two consecutive months
- DOM rising while sell-through falls simultaneously
- Realized margin after fees shrinking for three or more flips in a row in the same category
- Inventory aged beyond 10 months, which triggers margin distortion and capital loss risk
Action triggers:
- DOM above your category benchmark AND sell-through below 30%: run a flash sale or lower your asking price by 10–15%.
- Realized margin declining on a specific SKU type: stop restocking that item until you understand why.
- Aged stock above 20% of total inventory: prioritize liquidation over new sourcing.
Seasonal cycles shift these numbers. Electronics sell faster in November and December; furniture moves more in spring. Build a simple seasonal adjustment by comparing the same month year-over-year rather than month-over-month.
"Monthly metric tracking converts passive investors into active managers who can spot performance issues early." — Harvard Grace Capital
One important caution: small sample sizes mislead. If you have fewer than 10 realized sales in a category, don't change your sourcing strategy based on that data alone. Wait until you have a meaningful transaction count before drawing conclusions.
Which tools and workflows actually work for resellers?
Manual spreadsheets work fine when you are flipping a handful of items per month. Once you hold 30 or more active SKUs or cross-list across multiple platforms, the manual approach breaks down fast. Reconciling fees, tracking DOM, and catching aged stock by hand becomes a part-time job on its own.
Three practical tiers:
- DIY spreadsheets: Free, flexible, and good for learning the KPIs. Prone to data entry errors and hard to scale.
- Mixed-tool stack: Marketplace exports plus a spreadsheet plus manual scripts. More powerful, but requires consistent discipline to maintain.
- Reseller automation: A single dashboard that ingests listing data, tracks realized prices, flags aged stock, and surfaces scam signals automatically.
The feature checklist for any serious reseller tool should include automated realized-price capture, fee and label reconciliation, aged-stock alerts, a cross-listing profit calculator, and scam detection on incoming listings.
"Include all hidden costs in a unified dashboard to compute true margin by channel; otherwise high-volume channels can look more profitable than they actually are." — ResellrTrackr guidance
A note on privacy: when you track buyer IDs or contact details, handle that data carefully. Under US data-handling best practices, store only what you need, use hashed identifiers where possible, and never share buyer contact information with third parties.
Dealflip AI is built specifically for Facebook Marketplace flippers. It scans listings, scores each one on profit potential and risk, flags scam signals, and surfaces real-time alerts for fresh underpriced items, so your dashboard stays current without manual effort.
Monthly report template you can copy right now
A one-page monthly report should answer three questions at a glance: How liquid is my inventory? How profitable are my flips? Where is my risk concentrated?
| KPI | Formula | Example target |
|---|---|---|
| Completed sales (units) | Count of sold items in period | Baseline: grow month-over-month |
| Gross merchandise value (GMV) | Sum of all realized sale prices | Track trend, not absolute |
| Realized avg. sale price | GMV ÷ completed sales | Should exceed avg. asking price paid |
| Sell-through rate | Sold units ÷ avg. active listings | 60% for high-turn categories |
| Average DOM | Sum of DOM per sold item ÷ sold units | Under 14 days for fast categories |
| Net margin per flip | Realized price − (acquisition + fees + shipping + refurb) | Positive after all costs |
| Fees and shipping per flip | Total fees + shipping ÷ sold units | Monitor for creep over time |
| Aged stock % | Items >10 months ÷ total inventory | Keep below 15% |
Use listing transparency fields to pre-populate most of these rows from your capture log. Each month, reconcile raw settlement files, shipping labels, and cost receipts before finalizing the report.
How to protect your data from scams and bad records
Bad data produces bad decisions. Protecting your realized-price integrity starts before you buy.
Scam flags on Facebook Marketplace listings:
- Inconsistent location (listing says one city, seller messages from another)
- Multiple recent relists of the same item with identical photos but changing prices
- Price well below market combined with pressure to transact off-platform or via wire transfer
Use Dealflip AI's scam detection tool to surface these signals automatically before you commit to a purchase.
Data hygiene audit steps:
- Reconcile settlement reports weekly and flag any transaction without a matching listing ID
- Run duplicate detection on listing IDs monthly to catch double-counted sales
- Apply FIFO cost-basis tracking so profit calculations use the correct purchase price per sold unit
"Treat inventory like a managed ledger: FIFO cost-basis tracking and aged-stock alerts for items over 10 months keep your profit calculations accurate and your capital working." — ResellJoy inventory guidance
For aged stock, set an alert at the 10-month mark and follow a clear disposal path: lower the price by 20%, relist with updated photos, and if it still doesn't move within 30 days, liquidate rather than hold.
On buyer data: collect only what you need for reconciliation, store it securely, and follow US consumer data best practices. Never share payment receipts or contact details outside your own records.
Key Takeaways
Realized sale price, not asking price, is the single most important metric for any flipper measuring resale performance accurately.
| Point | Details |
|---|---|
| Realized price is ground truth | Always record what items actually sold for, never substitute asking price in your KPI log. |
| Monthly cadence beats ad hoc | A monthly report converts passive flipping into active portfolio management and surfaces problems early. |
| Aged stock needs a hard rule | Flag items at 10 months and liquidate within 30 days of a price cut if they still don't sell. |
| True margin includes all costs | Fees, shipping, and refurbishment must be in every margin calculation or your numbers will mislead you. |
| Dealflip AI automates the dashboard | Dealflip AI scans, scores, and flags listings so your KPI data stays current without manual effort. |
Why monthly KPI discipline changes everything
Monthly tracking is what separates flippers who grow from those who stay stuck. When you measure realized prices and sell-through consistently, your sourcing decisions stop being guesses. You start seeing which categories are thinning out, which items are aging, and where your fees are quietly eating your margin. That shift from reactive to proactive is the real payoff of building a dashboard. The measurement itself is not complicated. What matters is doing it every single month, not just when something feels wrong.
Dealflip AI puts your resale dashboard on autopilot
Tracking resale performance manually is possible, but it costs you hours every week and leaves gaps in your data. Dealflip AI gives Facebook Marketplace flippers a faster path from raw listings to clear decisions.
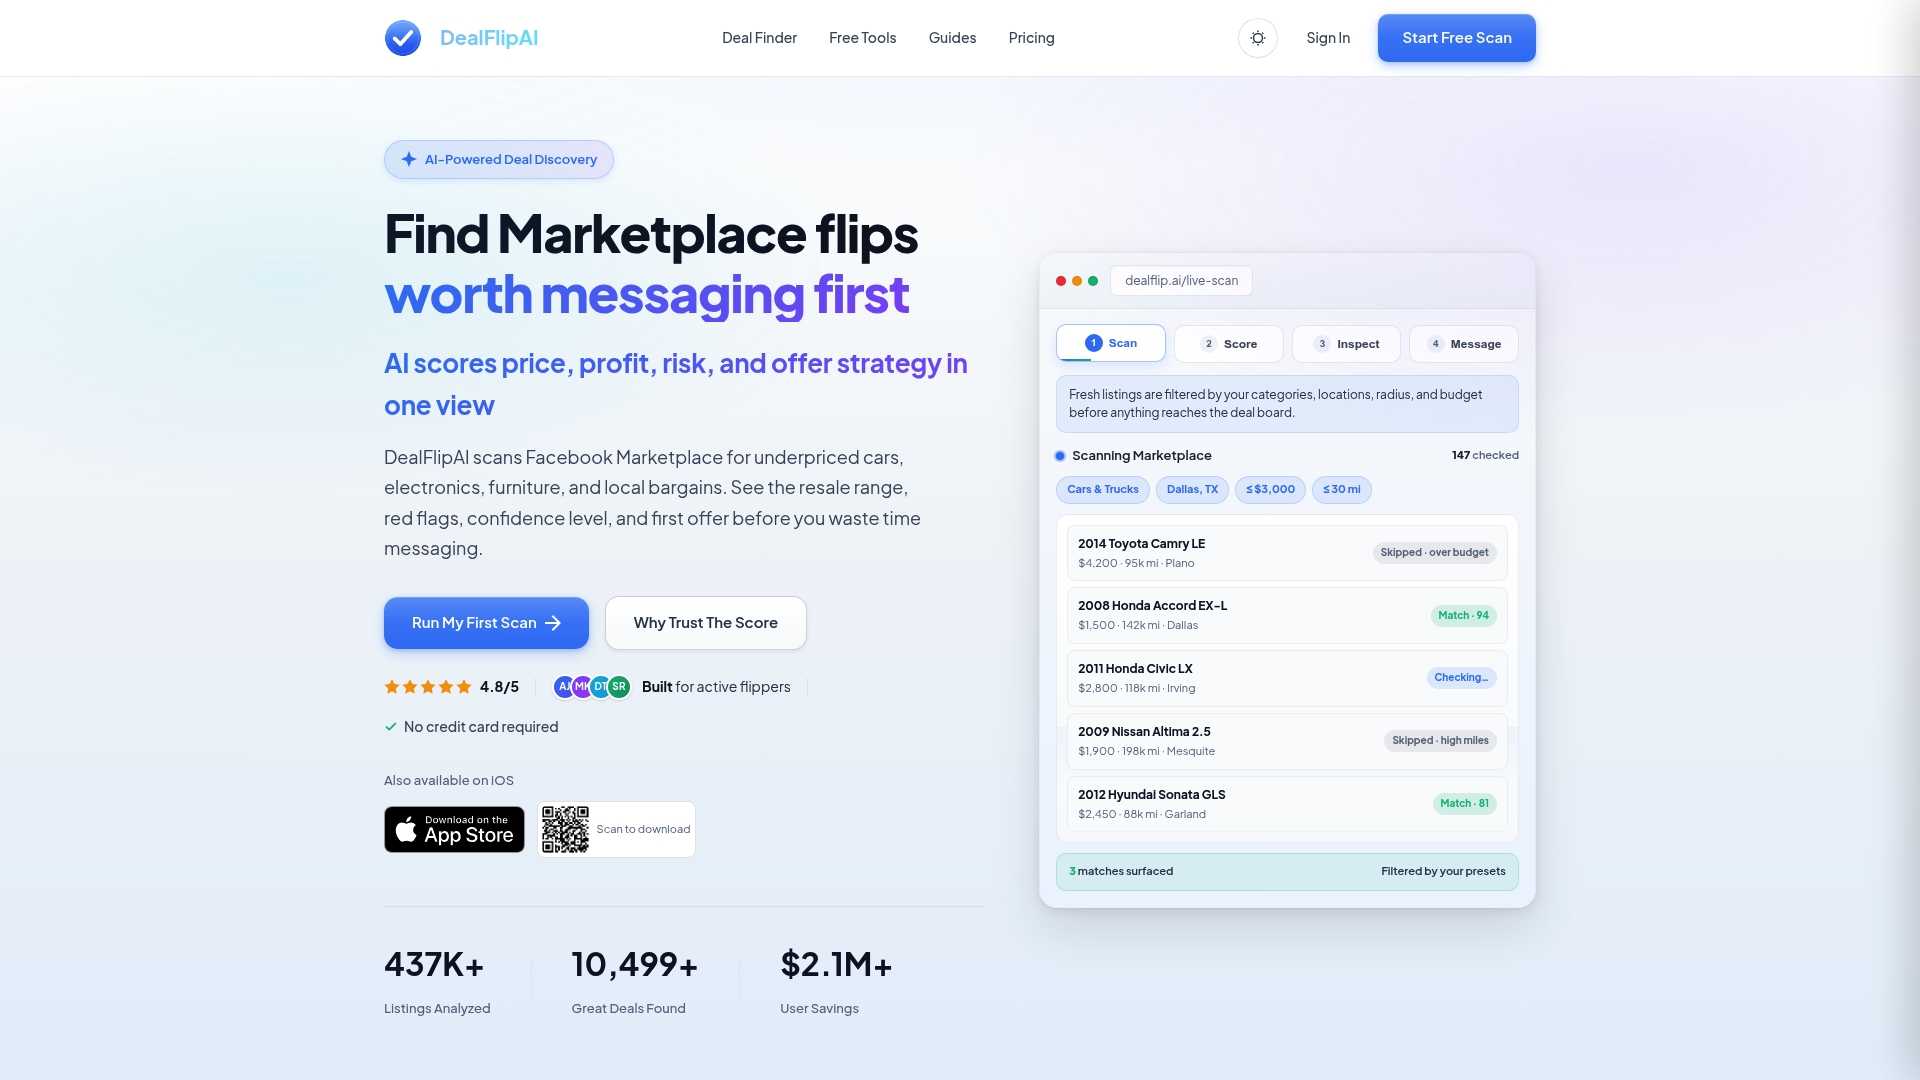
The platform scans Marketplace listings across categories including electronics, furniture, tools, and cars, then scores each one on profit potential, price versus fair value, and risk factors including scam signals. You get real-time alerts when fresh underpriced listings appear, a built-in listing analyzer that surfaces the asking-to-realized price gap, fee reconciliation tools, and a flip profit calculator that factors in all your costs before you commit. Aged-stock alerts and cross-listing comparisons are built in, so the KPIs from this guide are tracked for you, not by you.
Ready to see it in action? Find your first undervalued deal on Facebook Marketplace with Dealflip AI today.
Useful sources and further reading
The research and expert guidance that informed this guide:
- Azimira: Real Estate Market Analysis — Source for the dashboard approach combining liquidity, price movement, and operational signals (sections: core KPIs, dashboard build).
- Meraas: How Investors Evaluate Resale Strength — Bid-ask spread and transaction time as durable demand indicators (sections: core KPIs, benchmarks).
- Harvard Grace Capital: LP Investor Metrics to Track Monthly — Monthly cadence rationale for converting passive investors into active managers (sections: dashboard build, benchmarks).
- IOPscience: EV Resale Value Study — Large-scale realized-price data showing asking prices mislead; realized data is more reliable (sections: core KPIs, report template).
- Analyses.info: Secondhand Sales Analytics Guide — Data reconciliation, revenue taxonomy, and one-page dashboard recommendations (sections: dashboard build, report template).
- NestLedger: Resale Value Calculator — Guidance on basing offers on realized sales rather than asking prices (sections: core KPIs, BLUF).
- ResellrTrackr: Resale Operations and Hidden Costs — Hidden cost integration into a unified dashboard for true margin by channel (sections: core KPIs, tools and workflow).
- ResellJoy: Inventory Management for Resellers — FIFO cost-basis tracking and aged-stock alert best practices (sections: data hygiene, dashboard build).